 Production Monitoring G-BOX Production Monitoring G-BOX
[Industrial Production and Reporting Systems] |
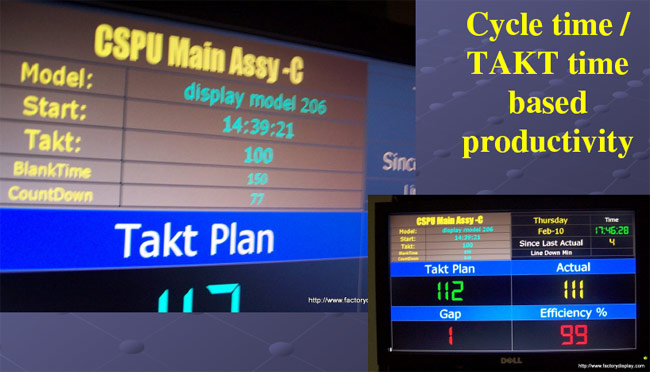
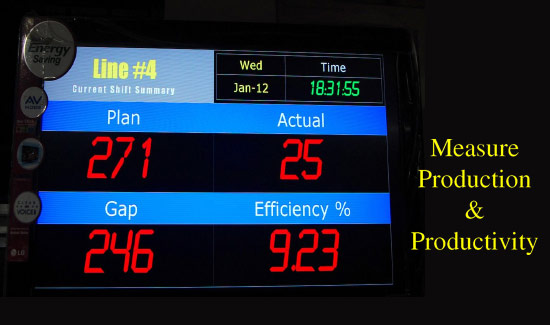
» Measure production
» Cycle time based productivity display to show real time target, actual, gap and efficiency
» Hourly production data for the line
» Set up the unit with shift start and end times and shift breaks
» Download production data live. Download CSV and import to MSEXCEL or other format to parse data.
» Communicate key information to employees and visitors
» Keep employees informed about important announcements, such as safety and other messages
» Highlight corporate and individual accolades, such as the Employee of the Month
» Provide recognition to employees on their birthday or anniversary

| For more details, click icons below. |
|
|
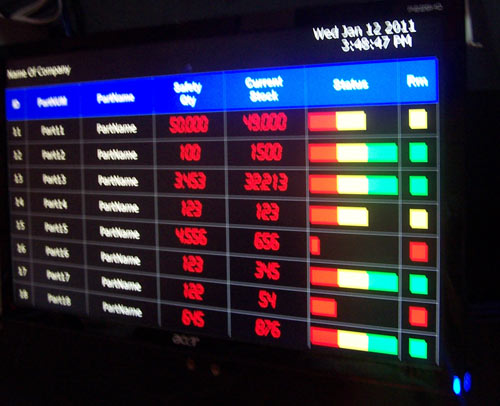
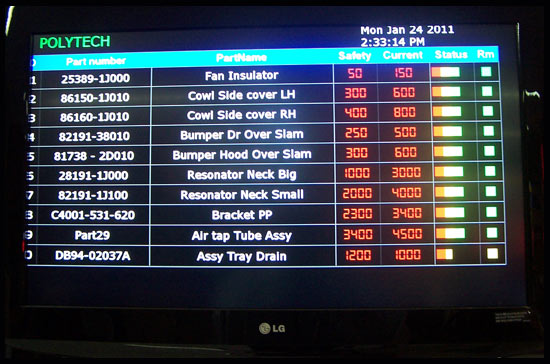
Stock / Inventory G-BOX |
» Display of current stock
» User interface allows updation of current stock. For auto updation, buy module # WIR - 2
» Fix re-order stock level
» Fix Maximum & Minimum stock level
» Measure production
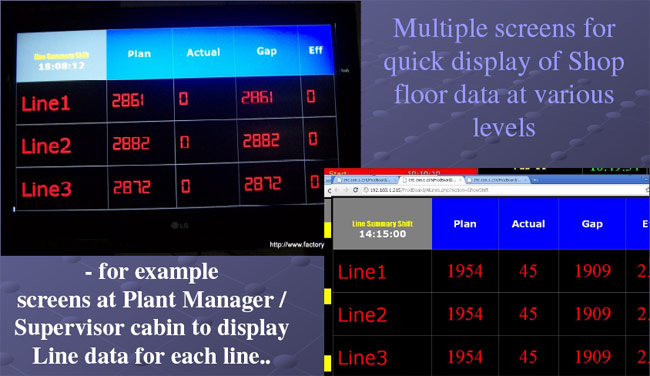
» Multiple screens for quick display of Shop floor data at various levels.
For example screens at Plant Manager / Supervisor cabin to display Line data for each line.
| For more details, click icons below. |
|
|
Cell Status / Downtime / Calling System
The system would allow monitoring for various production cells in a plant in realtime with the ability to locate cell stoppage. When stoppages are identified they can be qualified and
appropriate reasons assigned to them. The system can also display the plan actual gap and efficiency for each cell.
| For more details, click icons below. |
|
|
|
Pollution Monitoring G-BOX
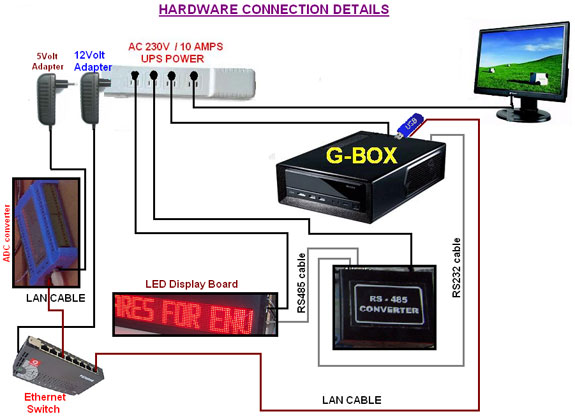
The ADC DAQ module allows you to capture data from upto 16 Analog sources, log and display them.
Basics:
You can login to the G-Box using "manager" as Pin. Once you have setup the IP address of G-Box using Setting -» Network section you can access G-Box from your lan by entering the Ip address assigned to the G-Box in a web browser (Google Chrome (Recomended), Firefox or IE ). You can login to G-Box by connecting a USB Keyboard and mouse to the Gbox and pressing Esc when the starting
splash screen is displayed.
| For more details, click icons below. |
|
|
Power Management G-BOX
Today there is a growing need to manage and reduce power consumption in factories and businesses. The solutions available today involve setting up sub-meters and connecting them and logging the power usage. This data is fed to power management and reporting systems which are basically analytic system to pinpoint the peak power usage location and times.
| » |
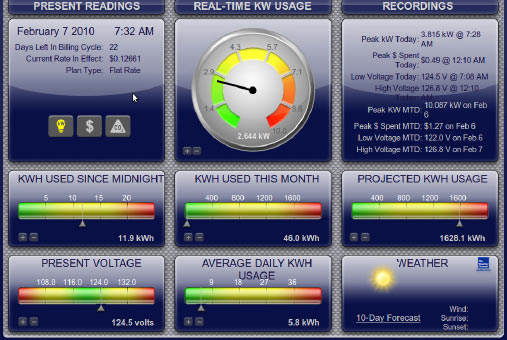
G-BOX offers real time power usage reduction using real time usage statistics of the power consumption. |
| » |
Presented in a easyway to understand intuitive interface to the people who are responsible for power usage. |
| » |
This data is presented on a LCD or Dashboard. |
| » |
The management or the supervisors can set Daily, Weekly and Monthly power consumption quotas for each of the areas or group of areas that are monitored. |
| » |
Our system will display this data along with actual real time power consumption data. |
| » |
This allows operators to see how they are placed in using the power quota. |
| » |
Our system also displays Hourly Quotas so the people on the floor will be able to see how much power they have left for the hour and decide if they can switch of some unused machinery which is in standby etc. |
| » |
This proactive method of displaying real time power consumption data allows the operators and supervisors to
react instantly and switch off unsed equipment and reduce power consumption. |
| » |
Alarms can be set to flash if there is going to be a over run of hourly quotas. This is calculated by extrapolating
the current average power usage over an hour and matching it with hourly quotas. |
| » |
You can have specific dashboard for each area being monitored and summary dashboards. |
| » |
The system also provides historical reports for analytics. |
|
|
| For more details, click icons below. |
|
|
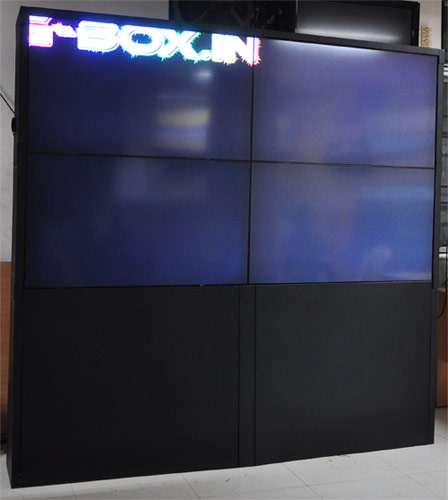
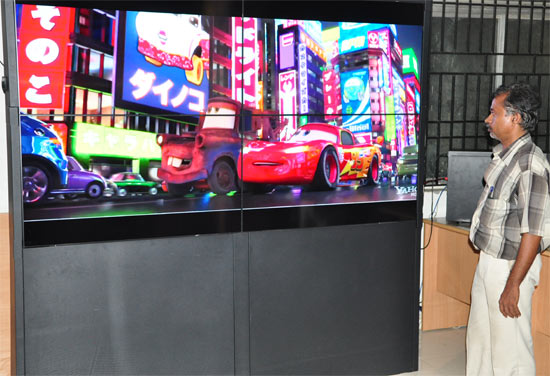
Video Walls |
G-Box Video wall solutions offer the ability to display standard digital signage content on a large format display ecnonlically.You can cascade 2x2 to 2x3 .. 6x6 displays to get a video wall.
| For more details, click icons below. |
|
|
